en
enDaily Analysis 17/07/2025
Latest Economic Insights
The dollars index rose to 98.4 after earlier volatility and concerns about Federal Reserve independence.
Gold declines as the dollar strengthens and trade risks decline.
Trump denies plans to fire Powell but continues to criticize interest rate policy
US Producer Price Index shows broader stability compared to CPI jump
EU-US trade talks, easing tensions with China (AI chips, Indonesia deal)
Oil rises on improved demand outlook and falling US crude inventories.
China’s oil imports jump 8.5% year-on-year, adding support to the market.
Bitcoin corrects below 120,000 after peaking near 123,200
Smart technical reports
How they work
A likely scenario is proposed for today, and the probability of this scenario being achieved, according to technical analysis, may be between 60% and 75%.
If the first scenario fails, the probability of the second scenario being achieved will be between 60% and 75% certain.
The first scenario fails when the price reaches the level of the alternative scenario condition, and the alternative scenario is immediately activated and the prediction from the first scenario is cancelled.
These reports are not considered a substitute for the trader’s decision, but rather they are a tool to assist the follower in making his own decisions, as a reference based on the origins of classical technical analysis.
GOLD
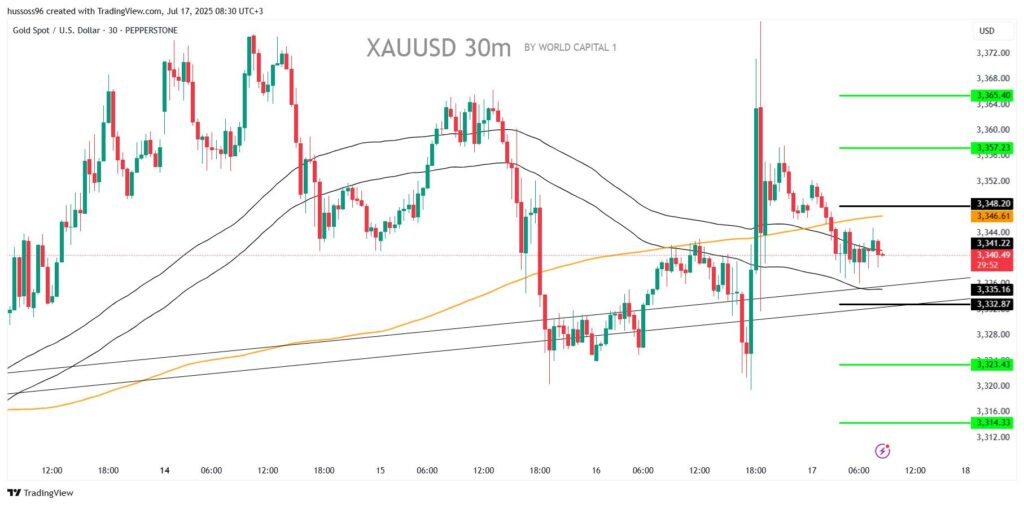
General trend: Sideways
Time interval: Half an hour (30 minutes)
Current price: 3,340.49
Scenario 1: Buy gold with a break and hold above 3,348.20 with a target price of 3,357.23 and then 3,365.40
Alternative scenario: Sell gold with a break and hold below 3,332.87 with a target price of 3,323.43 and then 3,314.33
Comment: Gold is fluctuating between critical averages, and a break of either end will direct the next movement
CRUDE OIL
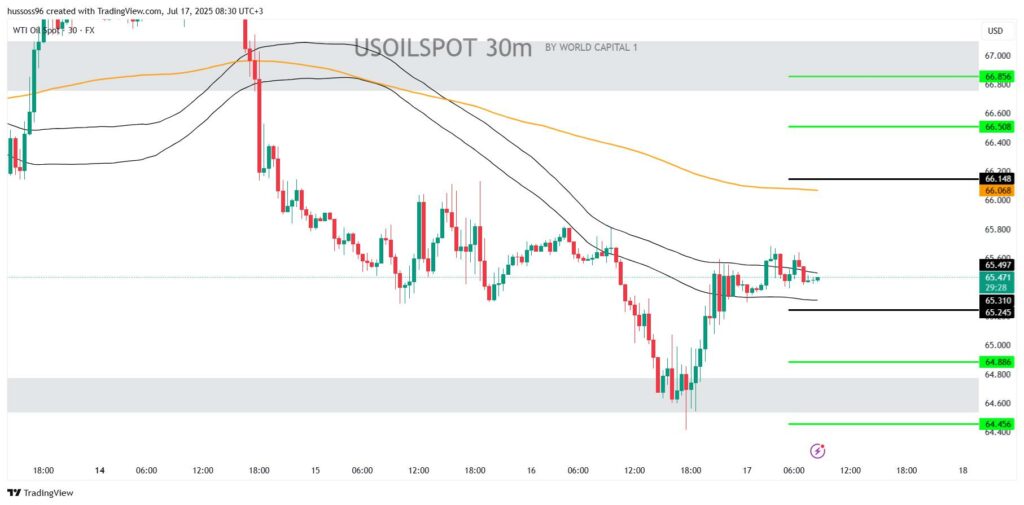
Trend: Sideways
Timeframe: Half an hour (30 minutes)
Current price: $65.47 per barrel
Scenario 1: Buy oil with a break and hold with a candle closing above 66.14, targeting 66.50 and then 66.85
Alternative scenario: Sell oil with a break of 65.24, targeting 64.88 and then 64.45
Comment: Holding below the averages still puts pressure on the price unless 66.14 is breache
EURUSD
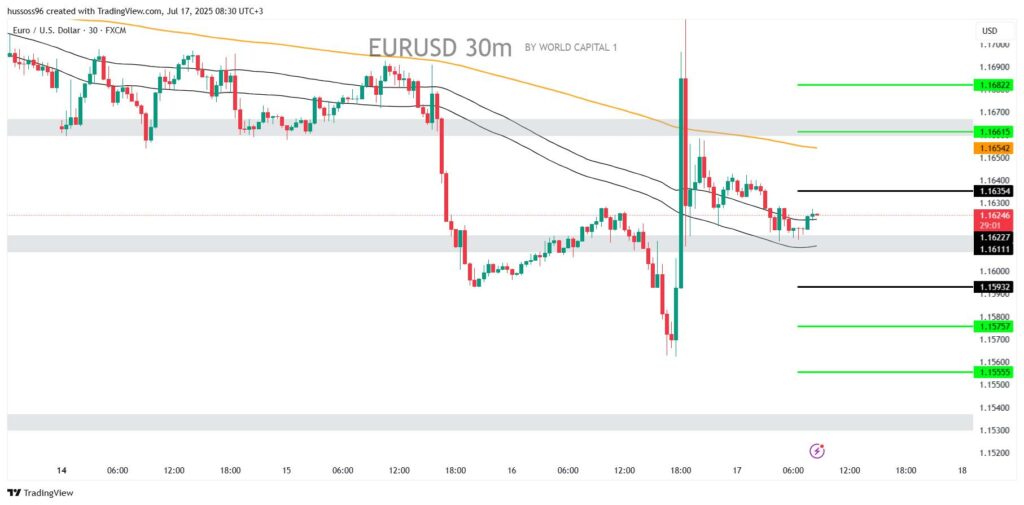
General trend: Sideways
Time interval: Half an hour (30 minutes)
Current price: 1.16246
Scenario 1: Buy EUR/USD after breaking 1.16354, targeting 1.16615 and then 1.16822
Alternative scenario: Sell EUR/USD after breaking and holding steady with a candle closing below 1.15932, targeting 1.15757 and then 1.15555
Comment: Limited movements within a range, and breaking resistance or support will determine the next trend
GBPUSD
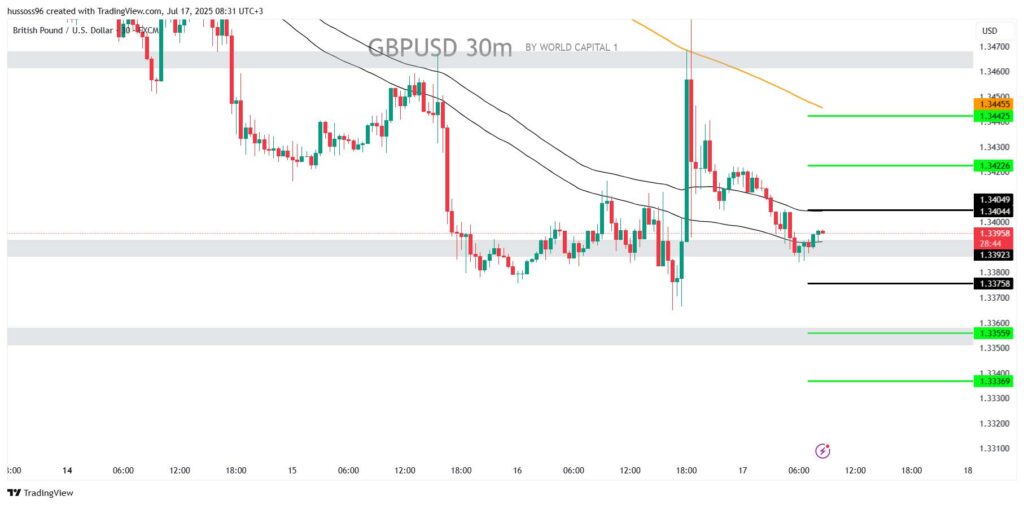
Trend: Sideways
Time interval: Half an hour (30 minutes)
Current price: 1.33958
Scenario 1: Buy GBP/USD with a break and hold above 1.34049, targeting 1.34226 and then 1.34425
Alternative scenario: Sell GBP/USD with a break and hold with a close below 1.33758, targeting 1.33559 and then 1.33369
Comment: Despite the rebound attempt, the price is still facing resistance at the averages
NAS100
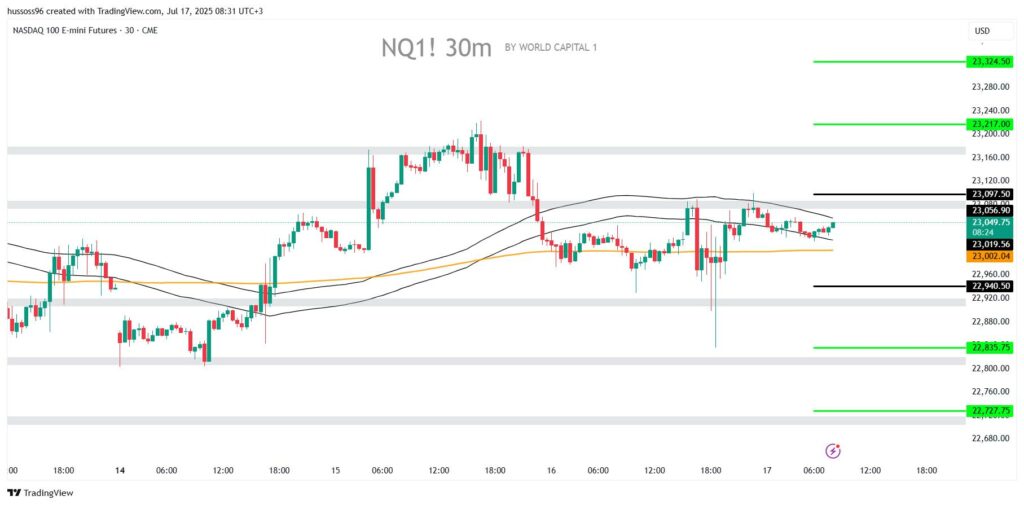
Trend: Sideways bullish
Time interval: Half an hour (30 minutes)
Current price: 23,049.75
Scenario 1: Buy the Nasdaq with a break and hold with a close above 23,097.50, targeting 23,217.00 and then 23,324.50
Alternative scenario: Sell the Nasdaq with a break and hold with a close below 22,940.50, targeting 22,835.75 and then 22,727.75
Comment: Consolidation above the averages keeps the bullish scenario valid unless the support is broken
Economic Calendar
(Times are in GMT+3)
From Europe: Consumer Price Index (YoY) (June) – 12:00
From the United States: Core Retail Sales (MoM) (June) – 15:30
From the United States: Unemployment claims rates – 15:30
From the United States: Philly Fed Manufacturing Index (July) – 15:30
From the United States: Retail Sales (MoM) (June) – 15:30
Fundamental Analysis
The US dollar index rose to 98.4 after a volatile session that saw it end the previous day weaker, as investors repriced risks related to the independence of the Federal Reserve following reports that President Trump was considering firing Fed Chairman Jerome Powell, which was later denied.
The June Producer Price Index reading showed relatively stable wholesale prices, in contrast to the apparent jump in the Consumer Price Index that raised inflationary concerns earlier in the week, supporting the view that the impact of tariffs may be uneven across price chains.
On the policy front, Trump reiterated his criticism of the interest rate path, while the European Union moved quickly to dispatch its top trade official to Washington to discuss the tariff issue. US-China tensions eased after restrictions on artificial intelligence chips were lifted and a trade agreement was reached with Indonesia, easing defensive demand for gold.
Gold fell toward $3,340 an ounce as the dollar strengthened and safe-haven flows receded, while traders awaited US retail sales data to gauge the strength of consumption under tariff pressure.
In energy, oil was supported by a combination of factors: improving US activity indicators, a milder-than-feared Chinese economic slowdown, a 3.9 million-barrel drop in US crude inventories according to the Energy Information Administration, and an 8.5% year-over-year increase in Chinese crude imports. Gains were limited by rising gasoline and diesel inventories and continued uncertainty about the impact of tariffs on global demand. Brent crude traded around $68, while WTI traded in the $65-$67 range.
In cryptocurrencies, Bitcoin entered a correction phase after breaching $123,200; the price is now trading below $120,000, with attempts at a potential technical recovery ahead if the nearest support areas hold.
Risk Disclaimer
Any information/articles/materials/content provided by WRPRO or displayed on its website is intended to be used solely for educational purposes only and does not constitute investment advice or a consultation on how the client should trade.
Although WRPRO has taken care to ensure that the content of such information is accurate, - it cannot be held responsible for any omission/error/miscalculation and cannot guarantee the accuracy of any material or any information contained herein.
Therefore, any reliance you place on such material is strictly at your own risk. Please note that the responsibility for using or relying on such material rests with the client and WRPRO accepts no liability for any loss or damage, including without limitation, any loss of profit which may arise directly or indirectly from the use of or reliance on such information.
Risk Warning: FX/CFDs are complex instruments and carry a high risk of losing money quickly due to leverage. You should consider whether you understand how FX/CFDs work and whether you can afford to take the high risk of losing your money.
You should make sure that, depending on your country of residence, you are allowed to trade with WRPRO products. Please ensure that you are familiar with the company’s risk disclosure.