en
enDaily Analysis 16/02/2026
Latest Economic Insights
Top headlines:
The U.S. Dollar Index remained stable below the 97-point level amid thin trading volumes due to the Presidents’ Day holiday.
Weaker-than-expected U.S. inflation data strengthened expectations of interest rate cuts later this year.
Gold retreated following strong gains but continues to hold structural support.
Oil extended its weekly decline as persistent oversupply pressures weighed on the market.
Bitcoin failed to sustain levels above $70,000 and came back under selling pressure.
Smart technical reports
How they work
A likely scenario for today is proposed, and the probability of this scenario occurring according to technical analysis may be between 60% and 75%.
If the first scenario fails, the probability of the second scenario occurring becomes between 60% and 75%.
The first scenario fails when the price reaches the level of the alternative scenario condition, and immediately the alternative scenario is activated and the prediction from the first scenario is cancelled.
These reports are not considered a substitute for a trader’s decision, but rather a tool to assist the follower in making their own decisions, as a reference based on the principles of classical technical analysis.
GOLD
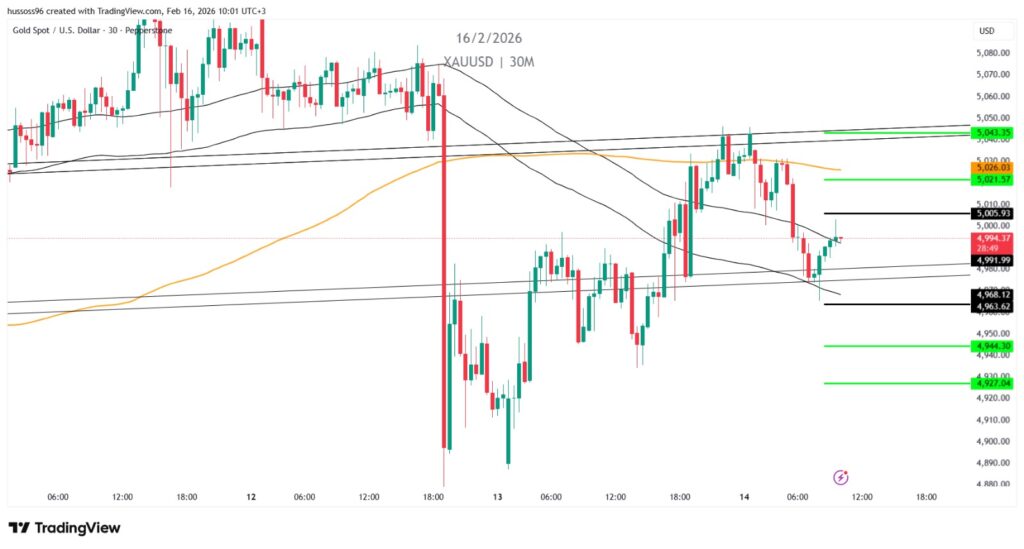
Trend: Sideways with a bearish bias within a corrective phase
Timeframe: 30 minutes
Current Price: 4,994.37
Primary Scenario: Buy on a breakout above 5,005.93
Targets: 5,021.57, followed by 5,043.35
Alternative Scenario: Sell on a break below 4,968.12
Targets: 4,944.30, followed by 4,927.04
Note: Gold is trading below a nearby resistance zone. Sustained price action below 5,005.93 keeps the bearish scenario as the more probable outcome.
CRUDE OIL
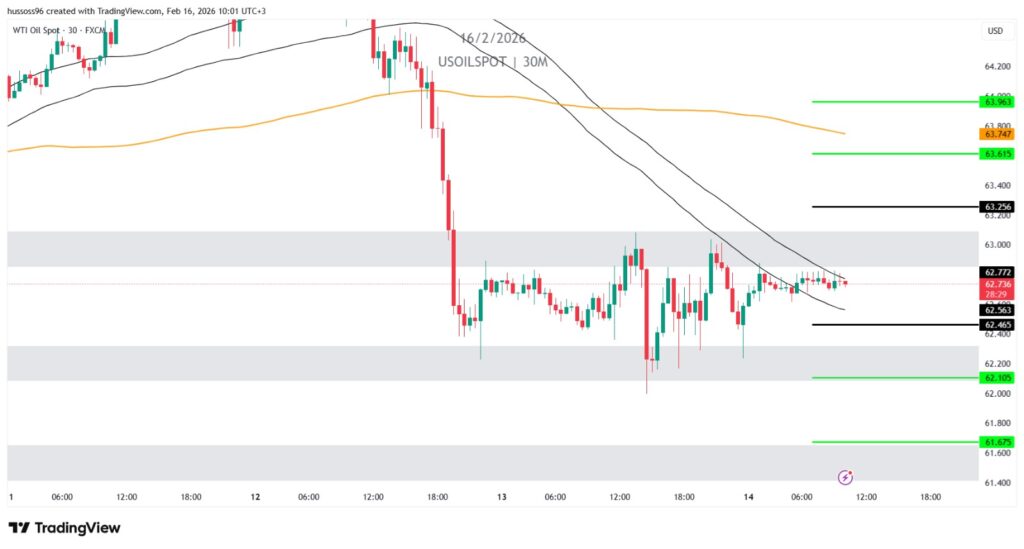
Trend: Sideways following a sharp decline
Timeframe: 30 minutes
Current Price: 62.736
Primary Scenario: Buy on a breakout above 63.256
Targets: 63.615, followed by 63.963
Alternative Scenario: Sell on a break below 62.465
Targets: 62.105, followed by 61.675
Note: Oil is consolidating after a steep sell-off. A break below 62.465 would open the door for a renewed downward wave.
EURUSD
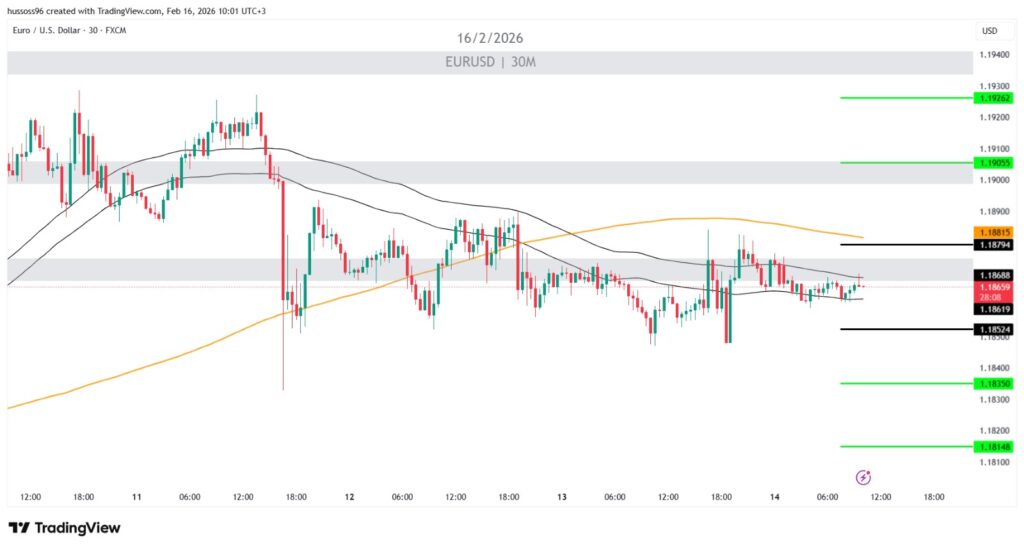
Trend: Sideways with a bearish bias
Timeframe: 30 minutes
Current Price: 1.18659
Primary Scenario: Buy on a breakout above 1.18794
Targets: 1.19055, followed by 1.19262
Alternative Scenario: Sell on a break below 1.18524
Targets: 1.18350, followed by 1.18148
Note: The price remains below a clear resistance level at 1.18794. Sustained trading beneath this level keeps selling pressure as the preferred scenario.
GBPUSD
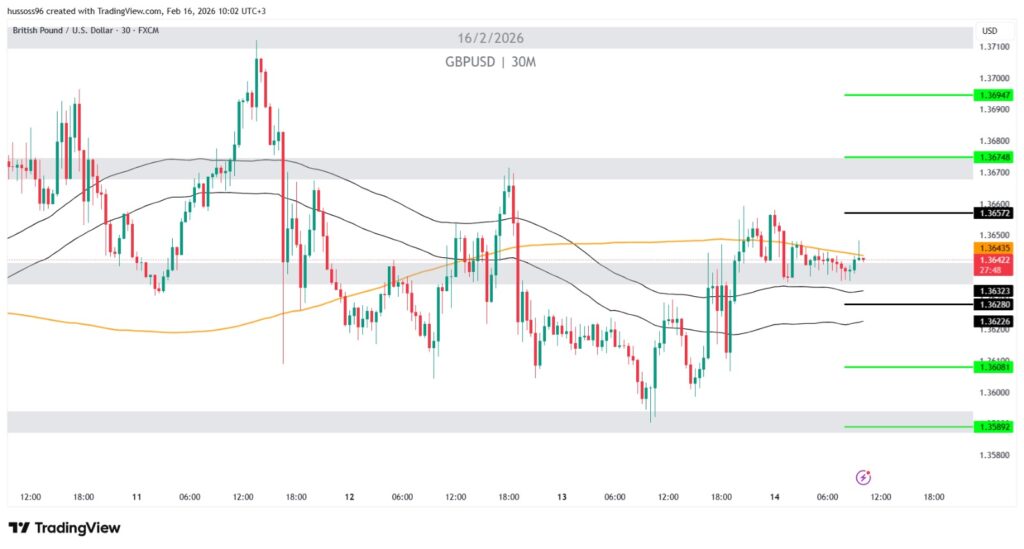
Trend: Sideways with a bearish bias
Timeframe: 30 minutes
Current Price: 1.36422
Primary Scenario: Buy on a breakout above 1.36572
Targets: 1.36748, followed by 1.36947
Alternative Scenario: Sell on a break below 1.36280
Targets: 1.36081, followed by 1.35892
Note: The pair is moving within a sideways range. A break below 1.36280 would reinforce selling pressure.
NAS100
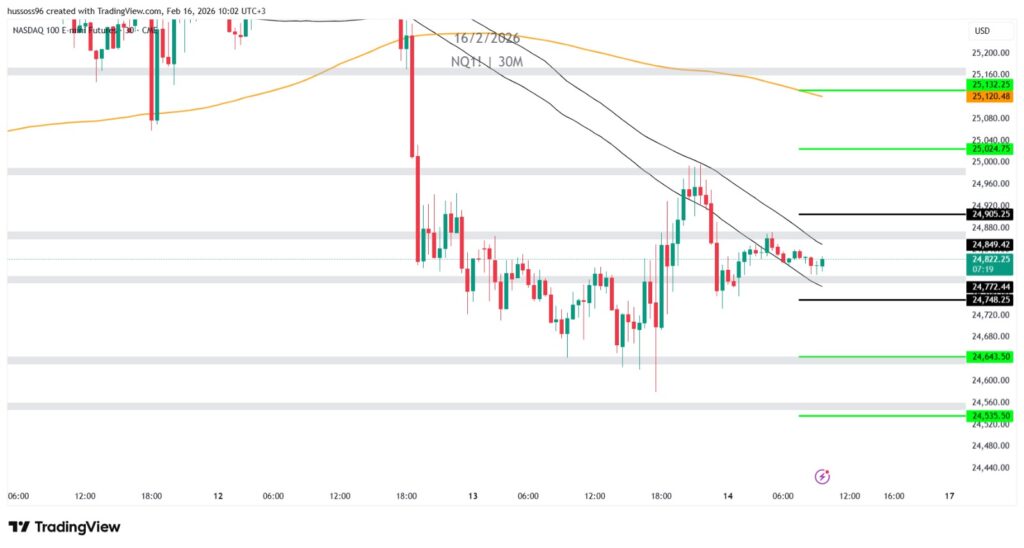
Trend: Bearish with consolidation after a sharp decline
Timeframe: 30 minutes
Current Price: 24,822.25
Primary Scenario: Buy on a breakout above 24,905.25
Targets: 25,024.75, followed by 25,132.25
Alternative Scenario: Sell on a break below 24,748.25
Targets: 24,643.50, followed by 24,535.50
Note: The overall trend remains bearish, and moving averages are exerting downward pressure on the price. Any upward move should be considered a corrective rally unless 24,905.25 is decisively breached.
Economic Calendar
(Times are in GMT+3)
From the United States:
No major economic data releases are scheduled due to the public holidays in several countries (USA, Canada, China)
Fundamental Analysis
- The U.S. Dollar and Monetary Policy:
The U.S. Dollar Index held steady below the 97-point level on Monday, trading in a narrow range amid limited activity as U.S. markets were closed for the Presidents’ Day holiday.
•
This stability followed pressure on the dollar last week after weaker-than-expected inflation data were released, showing:
Annual inflation easing to 2.4%, down from 2.6% previously
The monthly reading slowing to 0.2%, below expectations of 0.3%
•
These figures reinforced market bets that the Federal Reserve may begin an interest rate cutting cycle this summer.
•
Currently, markets are pricing in a potential rate cut in June, followed by an additional reduction in July, bringing the total expected easing to slightly more than two cuts in 2026.
Despite strong recent labor market data, which showed the largest increase in employment in over a year, moderating inflation has helped rebalance monetary policy expectations.
•
Investors are closely watching this week’s key releases, including:
The minutes of the Federal Open Market Committee (FOMC) meeting
The preliminary estimate of Gross Domestic Product (GDP)
Personal Consumption Expenditures (PCE) price index data
•
These releases are expected to provide clearer signals regarding the timing of the first interest rate cut.
Fundamental Analysis:
Start
- Gold & Silver:
Gold retreated below the $5,020 per ounce level after posting gains of more than 2% in the previous session.
•
The pullback was driven by:
Short-term profit-taking
Relatively subdued trading activity due to holiday-thinned markets
A modest decline in spot demand for safe-haven assets
•
Nevertheless, the medium-term trend remains supported by structural factors, including:
Continued central bank purchases
Ongoing geopolitical risks
Investors reallocating away from sovereign bonds and fiat currencies
•
As a result, the current decline is widely viewed as a technical correction rather than a shift in the broader underlying trend.
- Oil:
Oil prices continue to trade with a subdued tone, with Brent crude hovering near $67 per barrel and West Texas Intermediate (WTI) around $62–63 per barrel.
•
Markets are awaiting the second round of U.S.–Iran talks, amid indications that Tehran may be willing to discuss concessions in exchange for sanctions relief.
•
U.S.-led negotiations aimed at ending the war in Ukraine are also set to begin. However, expectations of a swift resolution remain low, limiting the likelihood of a near-term return of Russian supplies to global markets.
•
Despite ongoing geopolitical risks, prices remain under pressure due to:
Ample global supply
Expectations among some OPEC members of potentially resuming production increases in April
The International Energy Agency’s confirmation of a substantial supply surplus projected for 2026
•
As a result, oil continues to trade between political support factors and structural supply-side pressures.
Bitcoin:
Bitcoin failed to maintain trading above the $70,000 level and slipped back below $68,800.
•
The technical outlook indicates:
Weakening bullish momentum
Strong resistance in the $70,000–$72,000 range
The potential for an extended short-term pullback
•
Performance remains closely tied to broader risk sentiment and global liquidity flows.
Risk Disclaimer
Any information/articles/materials/content provided by WRPRO or displayed on its website is intended to be used solely for educational purposes only and does not constitute investment advice or a consultation on how the client should trade.
Although WRPRO has taken care to ensure that the content of such information is accurate, - it cannot be held responsible for any omission/error/miscalculation and cannot guarantee the accuracy of any material or any information contained herein.
Therefore, any reliance you place on such material is strictly at your own risk. Please note that the responsibility for using or relying on such material rests with the client and WRPRO accepts no liability for any loss or damage, including without limitation, any loss of profit which may arise directly or indirectly from the use of or reliance on such information.
Risk Warning: FX/CFDs are complex instruments and carry a high risk of losing money quickly due to leverage. You should consider whether you understand how FX/CFDs work and whether you can afford to take the high risk of losing your money.
You should make sure that, depending on your country of residence, you are allowed to trade with WRPRO products. Please ensure that you are familiar with the company’s risk disclosure.