en
enDaily Analysis 23/01/2026
Latest Economic Insights
Top headlines:
The U.S. dollar is on track to post a weekly decline of nearly 1%, following a week marked by heightened geopolitical volatility.
U.S.–European trade tensions have eased after former President Trump retreated from proposed tariff measures.
Gold has reached a new record high, supported by U.S. dollar weakness and increased demand for safe-haven assets.
Crude oil prices recorded modest gains amid a balance between resilient demand and concerns over excess supply.
Bitcoin is trading in a consolidation range below the $90,500 level, as markets await a decisive directional breakout.
Smart technical reports
How they work
A likely scenario for today is proposed, and the probability of this scenario occurring according to technical analysis may be between 60% and 75%.
If the first scenario fails, the probability of the second scenario occurring becomes between 60% and 75%.
The first scenario fails when the price reaches the level of the alternative scenario condition, and immediately the alternative scenario is activated and the prediction from the first scenario is cancelled.
These reports are not considered a substitute for a trader’s decision, but rather a tool to assist the follower in making their own decisions, as a reference based on the principles of classical technical analysis.
GOLD
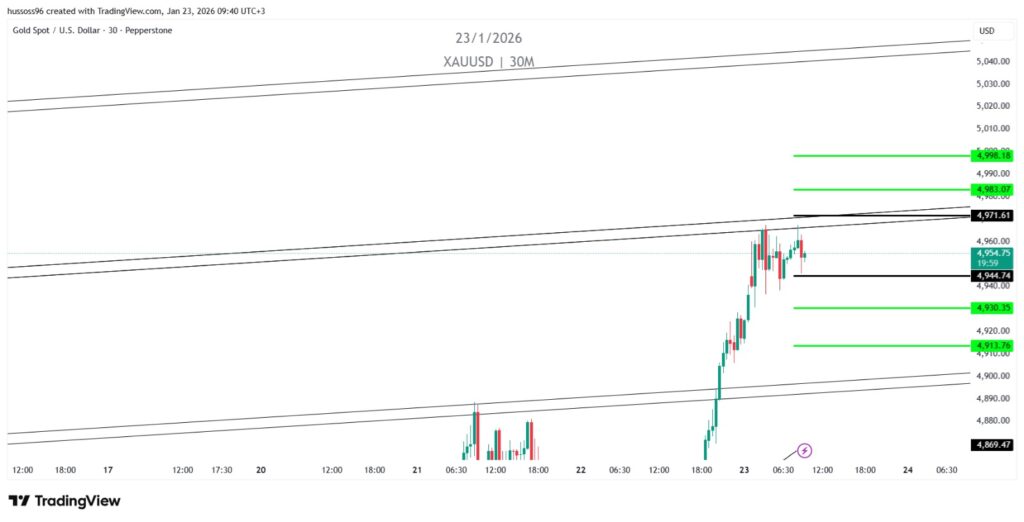
Trend: Strong bullish bias within an ascending channel
Timeframe: 30 minutes
Current Price: 4,954.75
Primary Scenario: Buy on breakout above 4,971.61
Targets: 4,987.07, then 4,998.18
Alternative Scenario: Sell on a break below 4,944.74
Targets: 4,930.35, then 4,913.76
Note: Gold is currently in a clear impulsive move within an ascending channel. Any pullback is considered corrective as long as prices remain above the 4,944 level.
CRUDE OIL
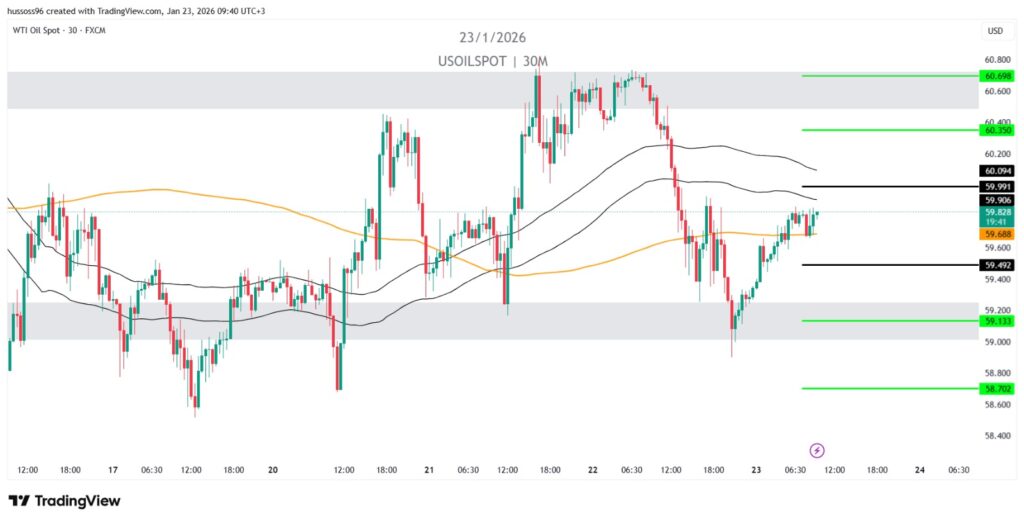
Trend: Range-bound with a bullish bias
Timeframe: 30 minutes
Current Price: 59.82
Primary Scenario (Bullish): Buy on breakout above 59.99
Targets: 60.35, then 60.69
Alternative Scenario (Bearish): Sell on a break below 59.42
Targets: 59.13, then 58.70
Note: Oil is rebounding from a strong demand zone. Holding above the 59.40 level keeps the bullish scenario intact.
EURUSD
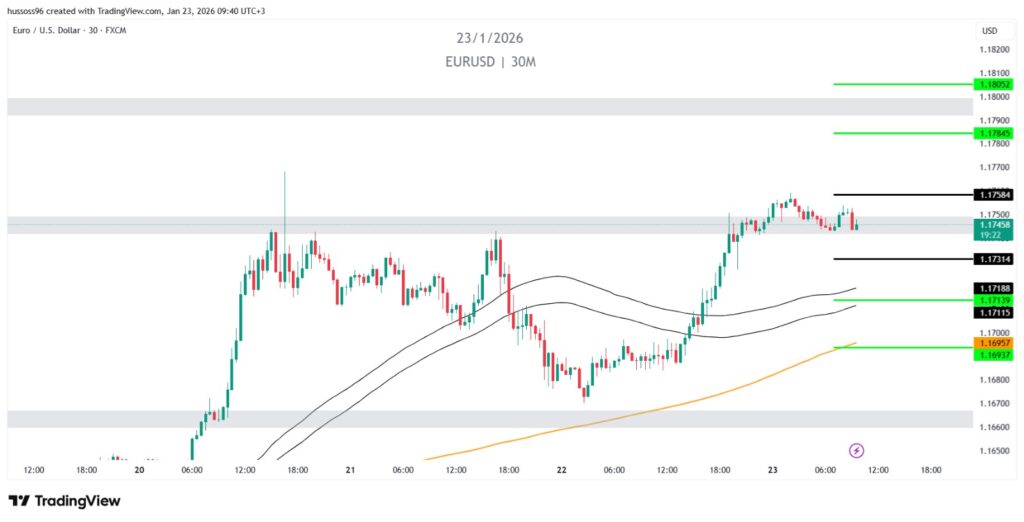
Trend: Bullish
Timeframe: 30 minutes
Current Price: 1.17458
Primary Scenario (Bullish): Buy on breakout above 1.17584
Targets: 1.17845, then 1.18052
Alternative Scenario (Bearish): Sell on a break below 1.17314
Targets: 1.17139, then 1.16957
Note: The overall trend remains positive, supported by price holding above the moving average. Continued trading above 1.173 reinforces the bullish outlook.
GBPUSD
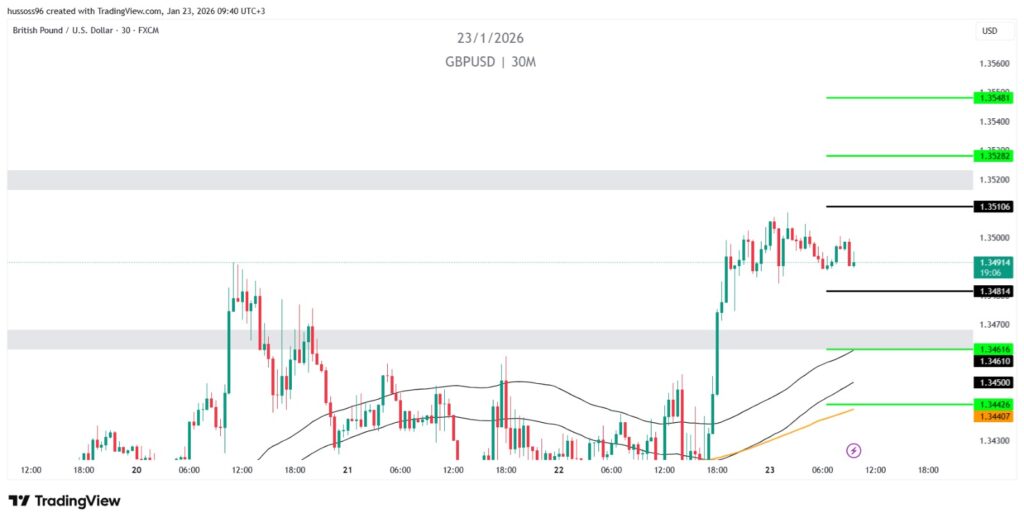
Trend: Bullish
Timeframe: 30 minutes
Current Price: 1.34914
Primary Scenario (Bullish): Buy on breakout above 1.35106
Targets: 1.35282, then 1.35481
Alternative Scenario (Bearish): Sell on a break below 1.34814
Targets: 1.34616, then 1.34426
Note: The pair is trading above its moving averages with progressively higher highs. Any break below support would indicate a corrective pullback rather than a trend reversal.
NAS100
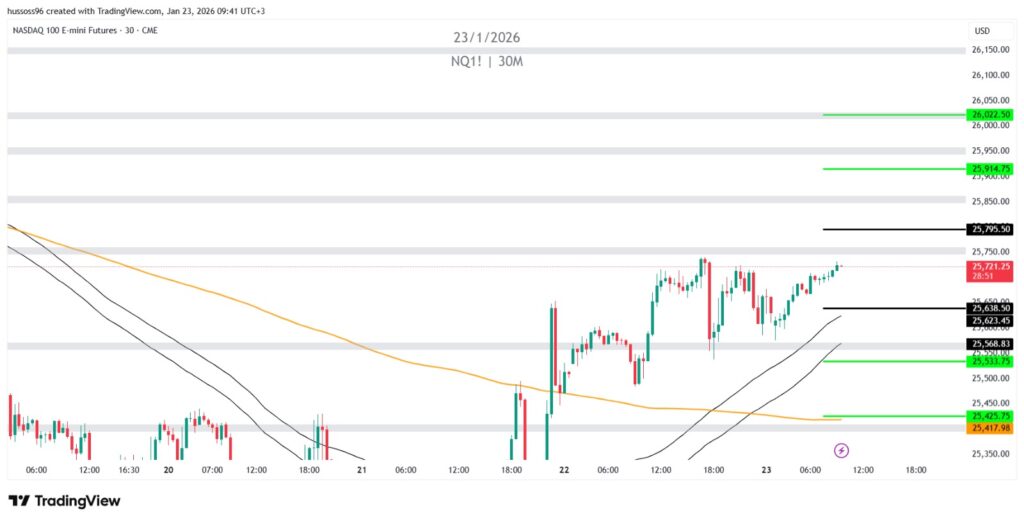
Trend: Corrective bullish following a break of a downward trend
Timeframe: 30 minutes
Current Price: 25,721.50
Primary Scenario (Bullish): Buy on breakout above 25,795.50
Targets: 25,914.75, then 26,022.50
Alternative Scenario (Bearish): Sell on a break below 25,685.50
Targets: 25,623.45, then 25,533.75
Note: The price has broken out of the descending channel and is holding above the moving averages. Sustained trading above 25,685 supports continued bullish momentum.
Economic Calendar
(Times are in GMT+3)
From the United States:
S&P Global Services PMI – January | 17:45
S&P Global Manufacturing PMI – January | 17:45
Fundamental Analysis
- The U.S. Dollar and Monetary Policy:
The U.S. Dollar Index stabilized near the 98.3 level on Friday but remains on track to record a weekly loss of approximately 1%, concluding a week marked by sharp volatility driven by political and trade developments between the United States and Europe.
•
The decline followed:
Earlier threats by former President Trump to impose tariffs on several European countries.
A sudden policy reversal after the announcement of a framework agreement with NATO granting the United States access rights to Greenland.
•
This fluctuation in political rhetoric has heightened investor uncertainty and weakened confidence in U.S. assets, placing sustained pressure on the greenback.
From a macroeconomic perspective, the latest Personal Consumption Expenditures (PCE) data came in line with expectations, signaling:
A continued gradual slowdown in inflationary pressures.
Relatively resilient economic activity.
•
Market pricing currently points to:
Interest rates remaining unchanged at the upcoming Federal Reserve meeting.
Expectations of two rate cuts over the course of 2026.
•
Investors are also closely monitoring former President Trump’s potential nomination of the next Federal Reserve Chair, as the appointment of a more dovish candidate could further weigh on the U.S. dollar.
- Gold & Silver:
Gold extended its strong momentum, surging above $4,950 per ounce to register a new all-time high and move toward its strongest weekly performance in years.
•
The rally has been supported by a confluence of factors, including:
Continued weakness in the U.S. dollar
Persistent geopolitical risks
Growing expectations of interest rate cuts
Strong inflows into safe-haven assets
•
Market participants are increasingly viewing gold as a dual hedge—both against elevated political risk and against anticipated monetary easing.
•
As long as the U.S. dollar remains under pressure, the medium-term outlook for gold remains constructive.
- Oil:
•
Oil prices posted modest gains, with Brent crude trading near $64 per barrel and WTI hovering around the $59–60 range.
•
Key sources of support included:
A weaker U.S. dollar
Statements from Saudi Aramco affirming strong global demand
Continued record-level consumption in China and the United States
•
However, upside momentum remained capped due to:
Warnings from the International Energy Agency regarding a potential global supply surplus
Rising prospects of a ceasefire in Ukraine
Easing geopolitical risks related to Iran
•
As a result, the oil market is currently navigating a delicate balance between demand-side support and mounting supply-side pressures.
Bitcoin:
•
Bitcoin is trading in a sideways range below the $90,500 level following a prior corrective decline.
•
At present:
Key support: $89,000–$90,000
Resistance: $91,500–$92,000
A decisive break above resistance could restore bullish momentum, while a failure to hold support may open the door to further downside correction.
•
Overall, the market appears to be in a consolidation phase, awaiting fresh catalysts to determine the next directional move.
Risk Disclaimer
Any information/articles/materials/content provided by WRPRO or displayed on its website is intended to be used solely for educational purposes only and does not constitute investment advice or a consultation on how the client should trade.
Although WRPRO has taken care to ensure that the content of such information is accurate, - it cannot be held responsible for any omission/error/miscalculation and cannot guarantee the accuracy of any material or any information contained herein.
Therefore, any reliance you place on such material is strictly at your own risk. Please note that the responsibility for using or relying on such material rests with the client and WRPRO accepts no liability for any loss or damage, including without limitation, any loss of profit which may arise directly or indirectly from the use of or reliance on such information.
Risk Warning: FX/CFDs are complex instruments and carry a high risk of losing money quickly due to leverage. You should consider whether you understand how FX/CFDs work and whether you can afford to take the high risk of losing your money.
You should make sure that, depending on your country of residence, you are allowed to trade with WRPRO products. Please ensure that you are familiar with the company’s risk disclosure.