 en
 العربية
Candlesticks
Candlesticks
Unlock exclusive trading videos and eductional content by logging in or creating an account
Frequently Asked Questions
How do you read a candlestick?
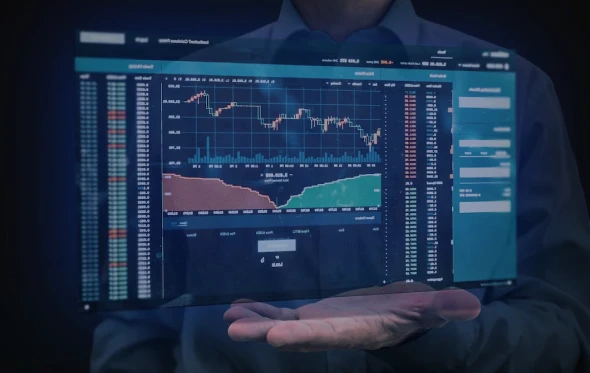
Each candlestick shows four prices for its time period: open, high, low and close. The rectangular body spans the open and close, while the thin wicks (or shadows) above and below mark the highest and lowest prices reached. A candle whose close is above its open is bullish (often green or white); a close below the open is bearish (often red or black). Reading the body-to-wick balance reveals who controlled the period, buyers or sellers.
What is the difference between the body and the wick of a candlestick?
The body is the thick rectangle between the opening and closing prices, showing the net move over the period. The wicks, also called shadows or tails, are the thin lines extending above and below the body, marking the highest and lowest prices touched. A long body signals strong directional momentum, while long wicks show rejection, meaning price pushed to an extreme but was pulled back before the close.
What does a bullish candlestick mean?
A bullish candlestick closes higher than it opened, meaning buyers dominated that period and pushed price up. It is usually shown in green or white. A large bullish body with small wicks reflects strong buying pressure. On its own a single candle is not a buy signal, so traders confirm it with the surrounding trend, support and resistance levels or other patterns before acting. Direction can always reverse on the next candle.
What colour are bullish and bearish candlesticks?
By default most platforms colour bullish candles (close above open) green and bearish candles (close below open) red, though white and black are also common and colours are customisable. On the WrPro platform you can adjust these to your preference. Remember colour only tells you the net direction of that period; the size of the body and the length of the wicks matter just as much for judging the strength behind the move.
Why are candlestick charts better than line charts?
A line chart plots only closing prices, so it shows direction but hides what happened within each period. A candlestick packs four data points, open, high, low and close, into one shape, revealing volatility, momentum and reversals a line cannot. This extra detail lets traders spot patterns and price rejection quickly. That said, candlesticks are a tool, not a guarantee, and work best combined with trend analysis and risk management.
What do long wicks on a candlestick indicate?
A long wick shows price reached an extreme during the period but was rejected before the close. A long lower wick means sellers pushed price down but buyers regained control, hinting at potential support. A long upper wick means buyers pushed up but sellers took over, hinting at resistance. Long wicks often warn of exhaustion or a possible reversal, but they signal probability, not certainty, so confirm with further candles.


