en
enDaily Analysis 27/04/2026
Latest Economic Insights
Top headlines:
- The U.S. dollar is experiencing volatility but remains resilient amid the breakdown of negotiations.
- The collapse of peace talks is reintroducing geopolitical risk into global markets.
- Gold continues to decline under pressure from inflationary dynamics and dollar strength.
- Oil is posting strong gains as supply disruptions persist.
- Markets are reinforcing expectations that interest rates will remain elevated for an extended period.
- Bitcoin maintains bullish momentum near elevated price levels.
Smart technical reports
How they work
A likely scenario for today is proposed, and the probability of this scenario occurring according to technical analysis may be between 60% and 75%.
If the first scenario fails, the probability of the second scenario occurring becomes between 60% and 75%.
The first scenario fails when the price reaches the level of the alternative scenario condition, and immediately the alternative scenario is activated and the prediction from the first scenario is cancelled.
These reports are not considered a substitute for a trader’s decision, but rather a tool to assist the follower in making their own decisions, as a reference based on the principles of classical technical analysis.
GOLD
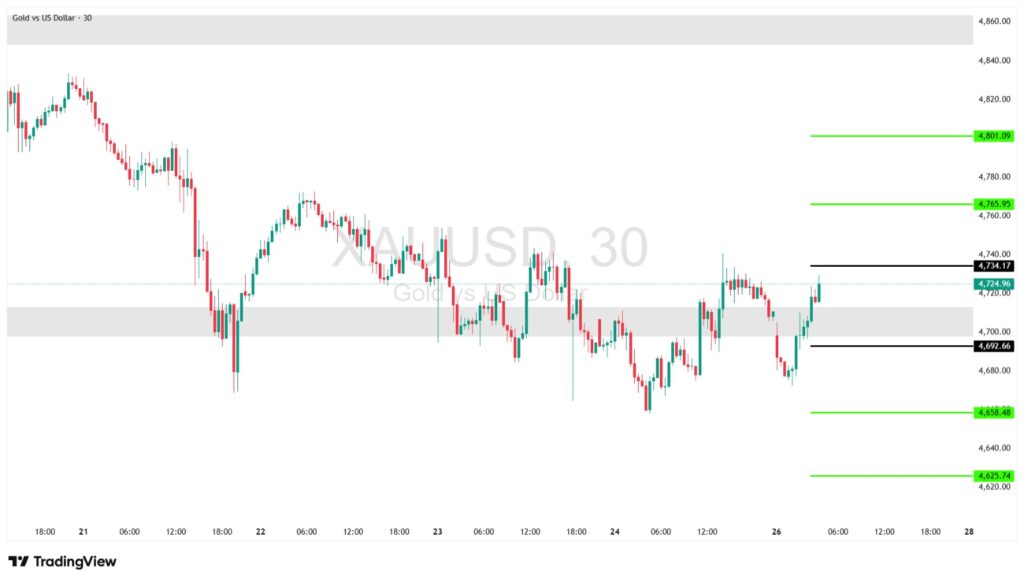
- Trend: Sideways with a bullish bias
- Timeframe: 30 minutes
- Current Price: 4,724
- Primary Scenario: Buy on a breakout above 4,734
- Targets: 4,765, then 4,801
- Alternative Scenario: Sell on a break below 4,692
- Targets: 4,658, then 4,625
- Note: Gold is trading within a range, and a decisive breakout in either direction is likely to determine the next trend.
CRUDE OIL
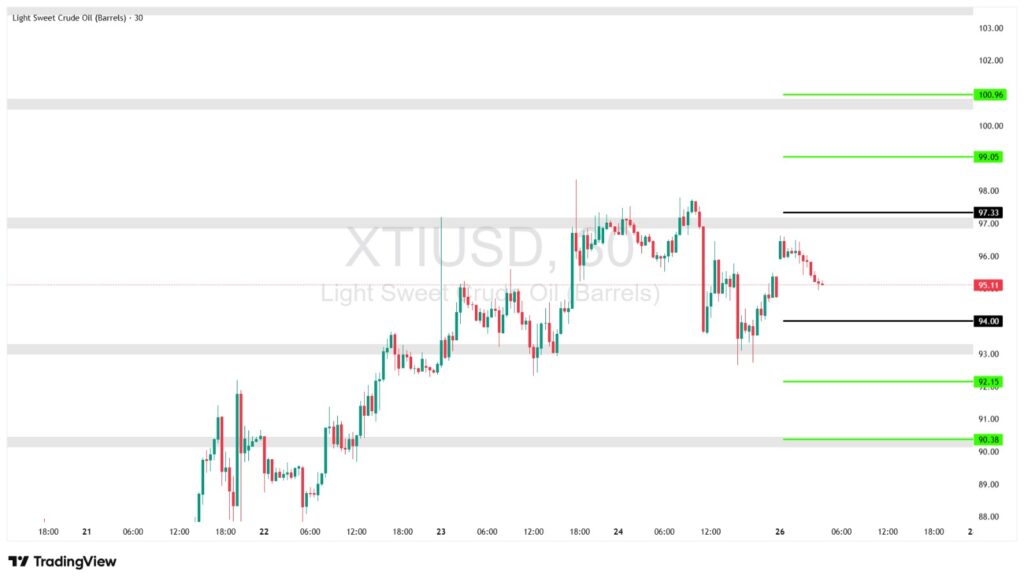
- Trend: Uptrend with a corrective pullback
- Timeframe: 30 minutes
- Current Price: 95.11
- Primary Scenario: Buy on a breakout above 97.33
- Targets: 99.05, then 100.96
- Alternative Scenario: Sell on a break below 94.00
- Targets: 92.15, then 90.38
- Note: The broader trend remains bullish, but the market is currently undergoing a corrective phase before a potential continuation higher.
EURUSD
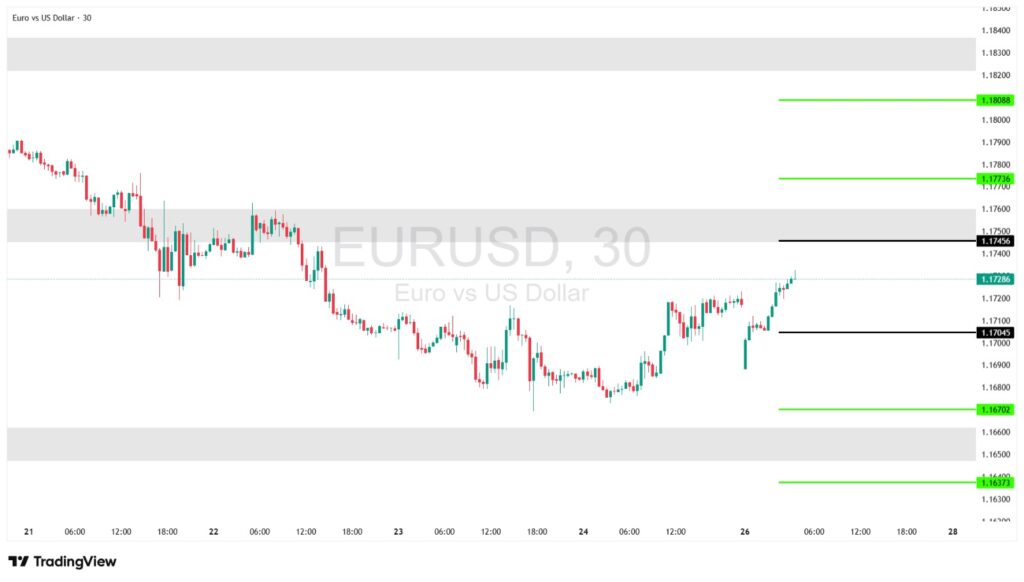
- Trend: Bullish corrective structure
- Timeframe: 30 minutes
- Current Price: 1.1728
- Primary Scenario: Buy on a breakout above 1.1745
- Targets: 1.1773, then 1.1808
- Alternative Scenario: Sell on a break below 1.1704
- Targets: 1.1670, then 1.1637
- Note: Price action is forming higher lows, indicating short-term weakening on the downside and suggesting continued bullish bias unless key support is broken.
GBPUSD
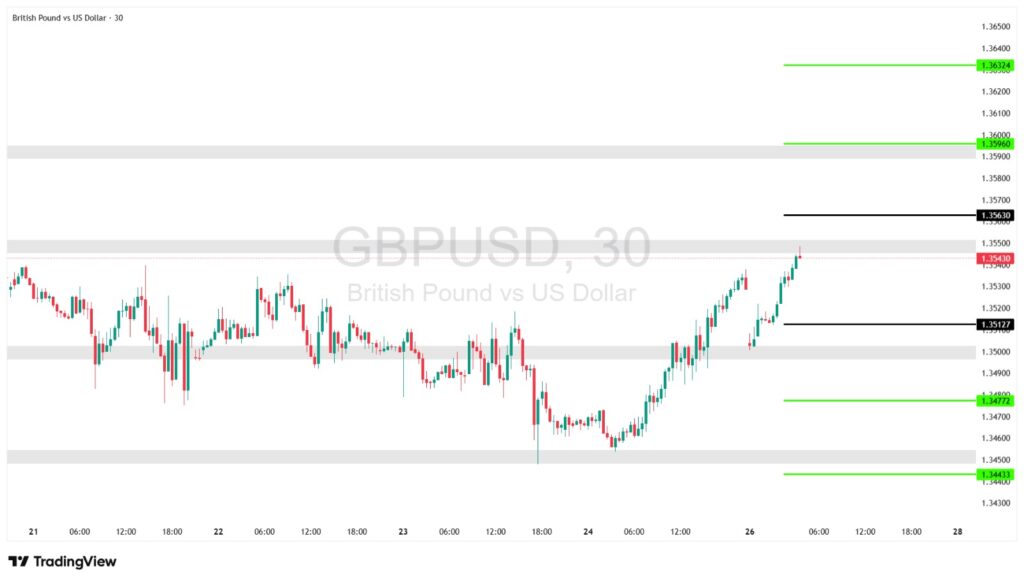
- Trend: Bullish (corrective within a range)
- Timeframe: 30 minutes
- Current Price: 1.3543
- Primary Scenario: Buy on a breakout above 1.3563
- Targets: 1.3596, then 1.3632
- Alternative Scenario: Sell on a break below 1.3512
- Targets: 1.3477, then 1.3443
- Note: The market is showing a gradual upward drift but remains range-bound. A confirmed breakout is required to validate the next directional move.
NAS100
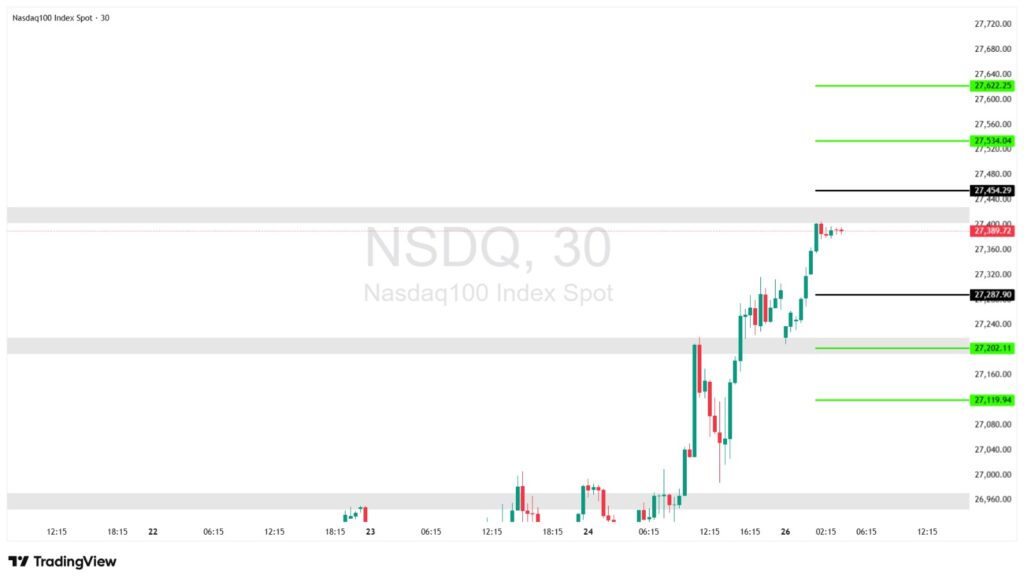
- Trend: Bullish
- Timeframe: 30 minutes
- Current Price: 27,389
- Primary Scenario: Buy on a breakout above 27,454
- Targets: 27,534, then 27,622
- Alternative Scenario: Sell on a break below 27,287
- Targets: 27,202, then 27,119
- Note: The market is in a strong uptrend, consolidating just below resistance. A breakout would signal continuation of bullish momentum.
Economic Calendar
(Times are in GMT+3)
- No major economic data releases scheduled for today.
Fundamental Analysis
- The U.S. Dollar and Monetary Policy:
• The U.S. Dollar Index climbed to 99.3 in Monday’s session before easing back toward 98.5, as uncertainty persisted following unsuccessful attempts to revive peace negotiations between United States and Iran.
• The decline followed a decision by Donald Trump to cancel the deployment of a negotiating delegation to Islamabad, while Tehran reaffirmed its stance against entering talks under pressure or sanctions.
• This ongoing political stalemate has left markets in a risk-averse mode, particularly as the effective closure of the Strait of Hormuz continues to weigh on the global geopolitical outlook.
From a monetary policy perspective, the prolonged energy crisis has heightened inflationary pressures, shaping investor expectations accordingly.
• These developments are driven by several factors:
- The ongoing closure of the Strait of Hormuz
- Elevated oil prices
- Continued disruptions to global supply chains
- Intensifying geopolitical tensions
• Collectively, these pressures have reinforced market expectations that interest rates will remain higher for longer, with the risk of further monetary tightening by central banks if inflation persists.
• At the same time, investors are focused on the upcoming meeting of the Federal Reserve, which may be the last chaired by Jerome Powell before a potential leadership transition to Kevin Warsh.
- Gold:
• Gold prices fell below $4,700 per ounce, extending losses for a second consecutive week.
• This performance is driven by several factors:
- Energy-driven inflationary pressures
- Reduced expectations for interest rate cuts
- Continued strength in the U.S. dollar
- Persistent selling pressure
• Despite its traditional role as a safe-haven asset, gold is facing a less supportive environment amid a tightening monetary policy backdrop.
- Oil:
• Oil prices continued to move higher, with:
- Brent Crude trading near $106 per barrel
- West Texas Intermediate hovering around $95 per barrel
• This upward momentum is driven by several factors:
- The ongoing closure of the Strait of Hormuz
- Stalled political negotiations
- Declining global supply
- Escalating geopolitical risks
• The International Energy Agency has described the situation as one of the most significant shocks in the history of the energy market.
Bitcoin:
• Bitcoin maintained its bullish momentum, surpassing the $78,500 level while showing relative price stability.
• This suggests:
- Continued liquidity inflows into the market
- Improved risk appetite among investors
- A potential move toward the $79,200 level
- Consolidation following a strong upward rally
Risk Disclaimer
Any information/articles/materials/content provided by WRPRO or displayed on its website is intended to be used solely for educational purposes only and does not constitute investment advice or a consultation on how the client should trade.
Although WRPRO has taken care to ensure that the content of such information is accurate, - it cannot be held responsible for any omission/error/miscalculation and cannot guarantee the accuracy of any material or any information contained herein.
Therefore, any reliance you place on such material is strictly at your own risk. Please note that the responsibility for using or relying on such material rests with the client and WRPRO accepts no liability for any loss or damage, including without limitation, any loss of profit which may arise directly or indirectly from the use of or reliance on such information.
Risk Warning: FX/CFDs are complex instruments and carry a high risk of losing money quickly due to leverage. You should consider whether you understand how FX/CFDs work and whether you can afford to take the high risk of losing your money.
You should make sure that, depending on your country of residence, you are allowed to trade with WRPRO products. Please ensure that you are familiar with the company’s risk disclosure.